Satellite Data and Warning Systems Highlight Recurring Flood Zones in Mumbai
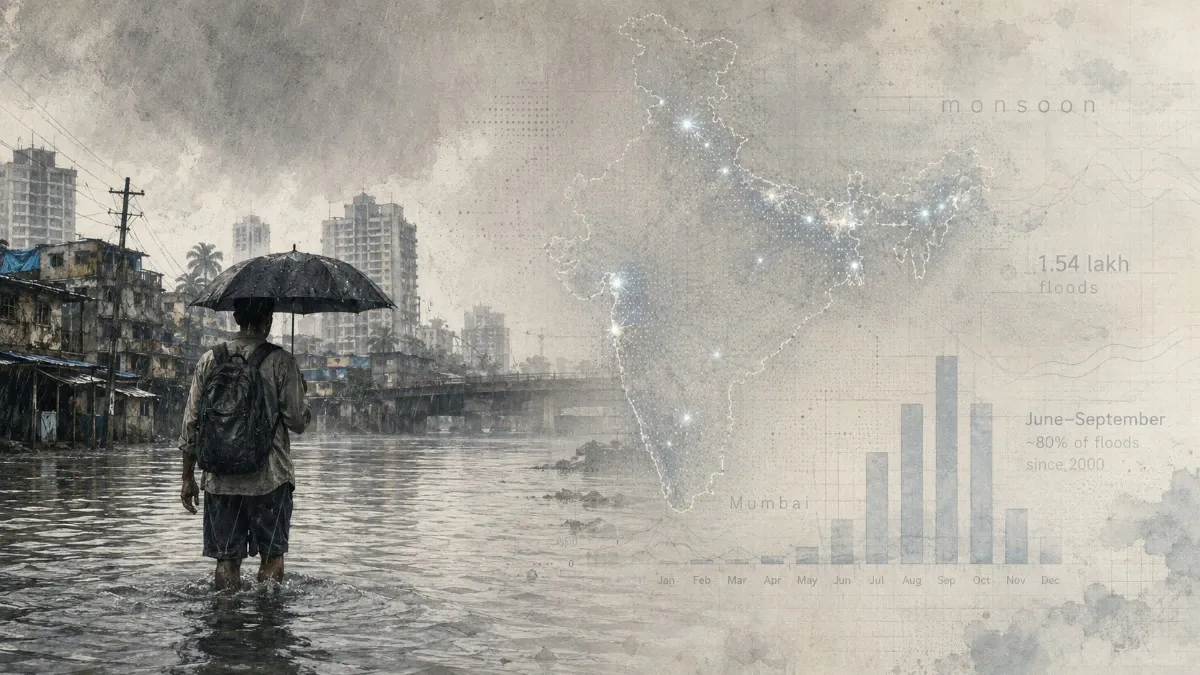
Mumbai experiences recurrent flooding in specific low-lying areas each monsoon, as satellite data and flood-mapping reveal persistent water accumulation in belts like Vasai-Virar and the Ulhas river basin. Heavy rains combined with factors such as clogged drains, tidal influences, and urban drainage limitations contribute to these floods. Urban flood warning systems in cities like Mumbai and Chennai integrate rainfall forecasts with local geography and infrastructure data to predict flood impact and guide timely responses.
First-hand measurement across 11 sources
We measured how 11 outlets covered this story. Coverage leans balanced overall (Left 0%, Centre 100%, Right 0%). Overall sentiment is neutral (48/100). Lens Score 42/100 — moderate-to-low public interest.
Outlets analysed (first-hand measurement by TBN's Bias Engine):
- businessstandard— balanced framing, neutral sentiment
- indiatoday— balanced framing, neutral sentiment
- indiatoday— balanced framing, neutral sentiment
- english— balanced framing, neutral sentiment
- news18— balanced framing, neutral sentiment
- news18— balanced framing, neutral sentiment
- indianexpress— balanced framing, neutral sentiment
- indianexpress— balanced framing, neutral sentiment
AI Analysis
The articles present a largely technical and infrastructural perspective on Mumbai's flooding, focusing on satellite data and urban flood warning systems without attributing blame or political responsibility. They include government meteorological forecasts and expert analyses, reflecting a neutral stance centered on factual reporting and urban planning challenges rather than political debate.
The overall tone is informative and neutral, emphasizing the challenges posed by monsoon rains and urban flooding while highlighting technological tools used for prediction and management. Coverage neither sensationalizes the floods nor downplays their impact, maintaining a balanced approach that acknowledges ongoing difficulties alongside efforts to improve flood forecasting.
How 11 sources covered this story
Each source's own headline, political lean, and sentiment — so you can see framing differences at a glance.