
India Budget 2026-27: A Critical Expert Analysis
Dissecting the Yuva Shakti Budget: What the numbers really tell us about India's economic direction, who wins, who loses, and what it means for 1.4 billion Indians
Published: February 2, 2026 | Reading Time: 15 minutes | By The Balanced News
Key Budget Stats at a Glance
| Metric | Value | Change |
|---|---|---|
| Total Expenditure | ₹53.47 Lakh Crore | +7.7% YoY |
| Capital Expenditure | ₹12.2 Lakh Crore | +8.9% YoY |
| Fiscal Deficit Target | 4.3% | Down from 4.4% |
| Debt-to-GDP Ratio | 55.6% | Down from 56.1% |
Table of Contents
- Budget at a Glance: The Big Picture
- Where Your Tax Money Goes: Sector-wise Breakdown
- Budget 2026 vs 2025: Year-on-Year Comparison
- Capital Expenditure: The Growth Engine Analysis
- Income Tax: The Middle Class Disappointment
- Manufacturing & Semiconductor Push: Reality Check
- Agriculture & Farmers: Promises vs Reality
- Defence Budget: Post-Sindoor Security Calculus
- Who Wins, Who Loses: Segment-wise Impact
- The Verdict: Expert Assessment
1. Budget at a Glance: The Big Picture
Finance Minister Nirmala Sitharaman presented her ninth consecutive Union Budget on February 1, 2026—a historic first, as no FM has ever delivered a budget on a Sunday. The Yuva Shakti Budget, as it has been branded, outlines three "Kartavyas" (duties): accelerating economic growth, fulfilling people's aspirations, and ensuring inclusive development under "Sabka Saath, Sabka Vikas."
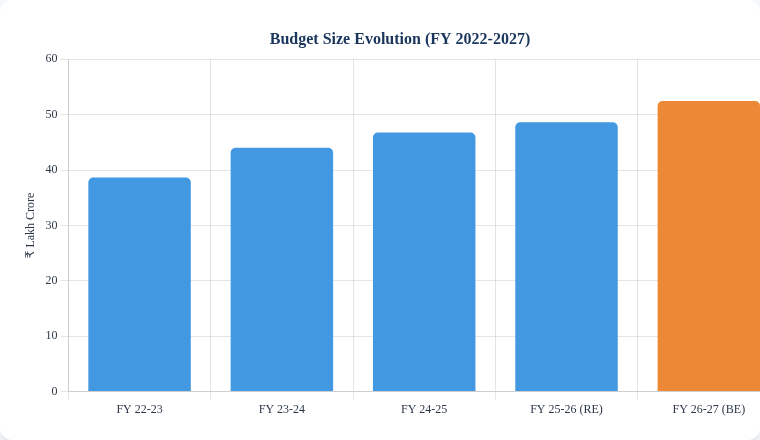
At ₹53.47 lakh crore, total government expenditure grows by 7.7% over the revised estimates of FY 2025-26. However, this headline number masks a more complex reality. The budget attempts to walk a tightrope between fiscal prudence and growth stimulus, with the fiscal deficit targeted at 4.3% of GDP—a marginal improvement from 4.4%.
Critical Observation: While the headline expenditure growth of 7.7% sounds impressive, adjusted for expected inflation of 4-4.5%, real expenditure growth is closer to 3-3.5%. This is hardly the "historic push" being claimed.
The government has shifted its fiscal framework from rigid deficit targeting to debt-to-GDP management, committing to bring this ratio to 50±1% by FY 2030-31 from the current 55.6%. This is a pragmatic move, providing flexibility while maintaining fiscal discipline.
2. Where Your Tax Money Goes: Sector-wise Breakdown
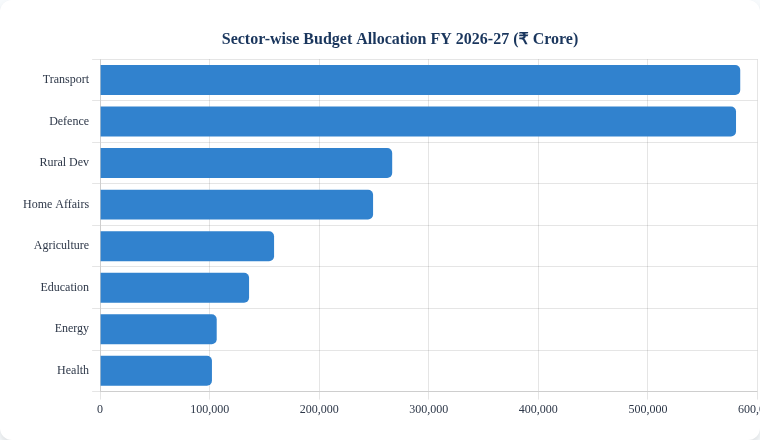
The allocation of government expenditure reveals clear priorities—and equally clear neglects. Transport and Defence dominate the landscape, accounting for nearly ₹12 lakh crore combined, while critical social sectors like health and education receive comparatively modest allocations.
Sector-wise Allocation Table
| Sector | Allocation (₹ Cr) | % of Total | YoY Change |
|---|---|---|---|
| Transport (incl. Railways, Roads) | 5,98,520 | 11.2% | +12.3% |
| Defence | 5,94,585 | 11.1% | +15.2% |
| Rural Development | 2,73,108 | 5.1% | +8.3% |
| Home Affairs | 2,55,234 | 4.8% | +9.1% |
| Agriculture & Allied | 1,62,671 | 3.0% | +6.8% |
| Education | 1,39,289 | 2.6% | +5.2% |
| Energy | 1,09,029 | 2.0% | +7.5% |
| Health | 1,04,599 | 1.96% | +10% |
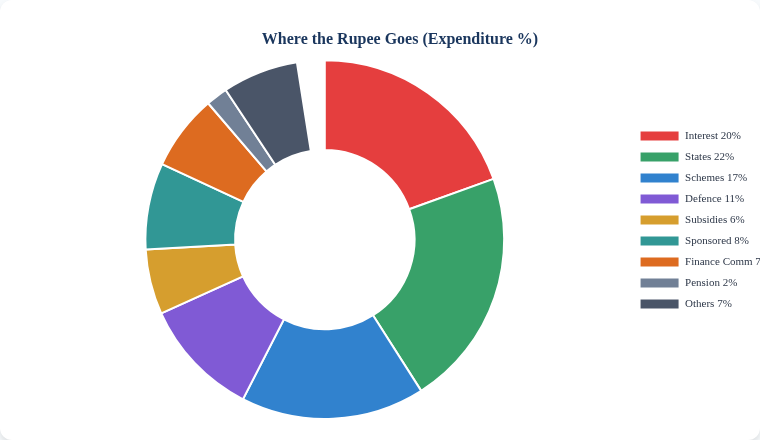
| Interest Payments | ~10,70,000 | 20% | +8.2% |
Red Flag: Health expenditure at 1.96% of total budget (approximately 1.2% of GDP) remains woefully inadequate. The National Health Policy 2017 targeted 2.5% of GDP by 2025—a goal India has comprehensively missed. For context, China spends 3.2%, Brazil 4%, and the global average is 6.5%.
3. Budget 2026 vs 2025: Year-on-Year Comparison
A meaningful budget analysis requires comparing apples to apples.
| Metric | FY 2025-26 (RE) | FY 2026-27 (BE) | Change |
|---|---|---|---|
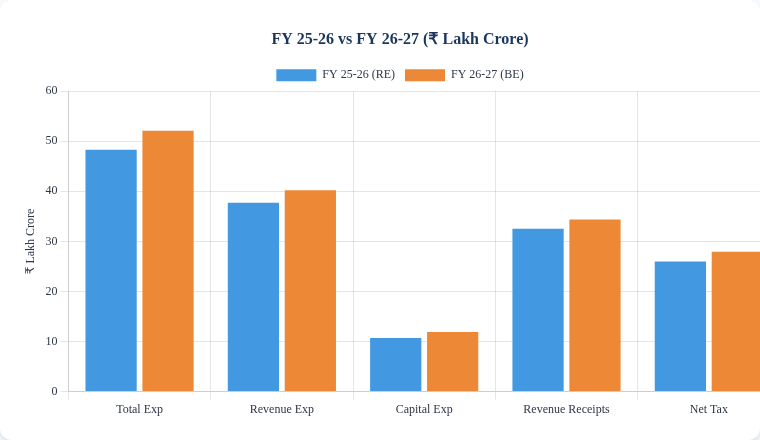
| Total Expenditure | ₹49.64 lakh crore | ₹53.47 lakh crore | +7.7% |
| Revenue Expenditure | ₹38.70 lakh crore | ₹41.30 lakh crore | +6.7% |
| Capital Expenditure | ₹11.00 lakh crore | ₹12.22 lakh crore | +11.1% |
| Revenue Receipts | ₹33.42 lakh crore | ₹35.33 lakh crore | +5.7% |
| Net Tax Revenue | ₹26.70 lakh crore | ₹28.70 lakh crore | +7.5% |
| Fiscal Deficit (% GDP) | 4.4% | 4.3% | -0.1 pp |
| Debt-to-GDP | 56.1% | 55.6% | -0.5 pp |
| Gross Borrowing | ₹11.70 lakh crore | ₹17.20 lakh crore | +47% |
Key Insight: While the fiscal deficit marginally improves, gross market borrowing jumps a staggering 47% to ₹17.2 lakh crore. This suggests the government is front-loading borrowing, potentially to take advantage of current interest rate environment before global monetary conditions tighten further.
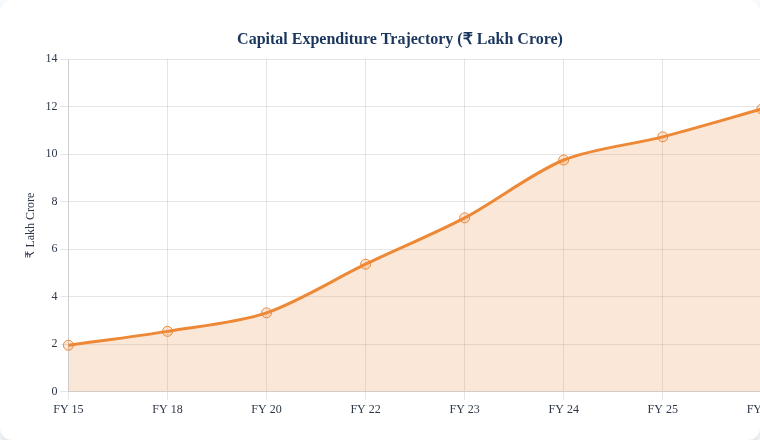
4. Capital Expenditure: The Growth Engine Analysis
Capital expenditure (capex) has been the Modi government's signature economic policy lever since 2020. Budget 2026-27 proposes ₹12.2 lakh crore in capex—a 510% increase from ₹2 lakh crore in FY 2014-15.
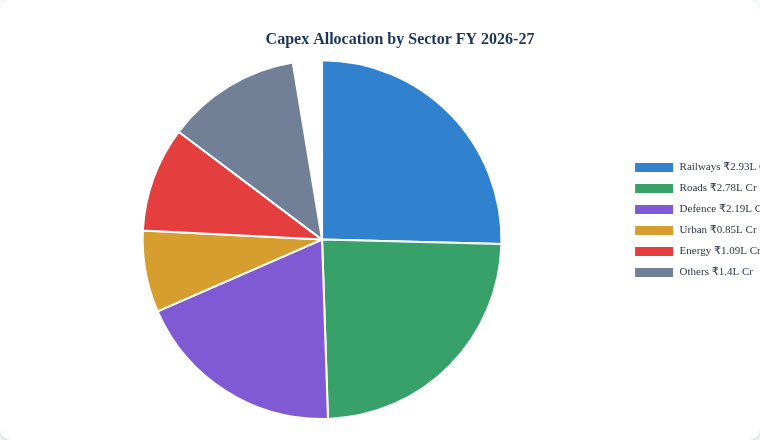
Where is the Capex Going?
- Railways: ₹2,93,030 crore (+10.3% YoY) — Highest ever allocation, 7 new high-speed rail corridors announced
- Roads & Highways: ₹2,78,000 crore — Focus on 20 new national waterways and logistics connectivity
- Defence Capital: ₹2,19,306 crore (+21.8% YoY) — Sharp increase for aircraft, aero engines, and indigenous equipment
- Urban Development: ₹85,522 crore — Smart cities, metro expansion, water supply
Concern: The 8.9% capex growth, while positive, is the slowest since the post-COVID capex push began. In FY 2024-25, capex grew 17%. This deceleration, combined with rising interest payments (now 20% of total expenditure), suggests fiscal space for sustained high capex is narrowing.
5. Income Tax: The Middle Class Disappointment
If there was one expectation the salaried middle class had from Budget 2026, it was tax relief. The verdict: Complete disappointment.
Finance Minister Sitharaman announced no changes to income tax slabs under either the old or new regime. The standard deduction remains at ₹75,000. The 30% peak rate continues to kick in at ₹24 lakh.
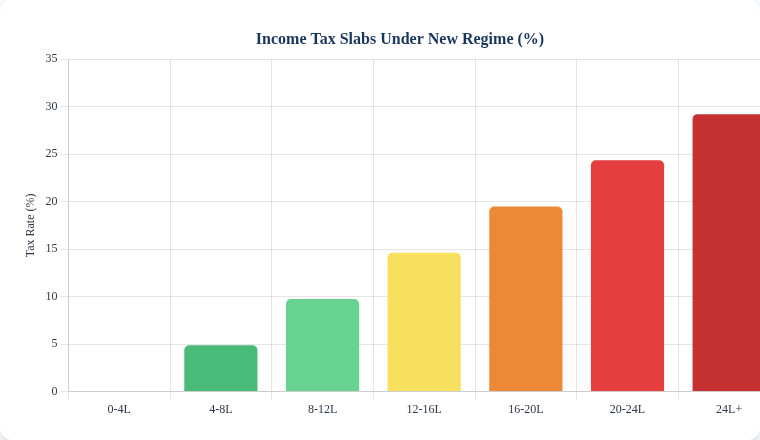
Income Tax Slabs (New Regime - Unchanged)
| Income Slab | Tax Rate | Status |
|---|---|---|
| Up to ₹4 lakh | Nil | No Change |
| ₹4 lakh - ₹8 lakh | 5% | No Change |
| ₹8 lakh - ₹12 lakh | 10% | No Change |
| ₹12 lakh - ₹16 lakh | 15% | No Change |
| ₹16 lakh - ₹20 lakh | 20% | No Change |
| ₹20 lakh - ₹24 lakh | 25% | No Change |
| Above ₹24 lakh | 30% | No Change |
What DID Change for Taxpayers
- TCS Rates Rationalized: Threshold for TCS on foreign remittances increased
- Revised ITR Filing Deadline: Extended timeline for filing revised returns
- New Income Tax Act: Simplified tax code promised, expected to be half the length of current 1961 Act
- STT Hiked: Securities Transaction Tax increased on F&O trades—a stealth tax on active traders
Expert Take: The government's reluctance to provide direct tax relief while simultaneously hiking STT and maintaining high indirect taxes reveals a concerning pattern. A person earning ₹20 lakh pays an effective rate exceeding 35% when all taxes are considered.
6. Manufacturing & Semiconductor Push: Reality Check
The Budget doubles down on the "Make in India" vision with significant announcements in electronics, semiconductors, and component manufacturing.
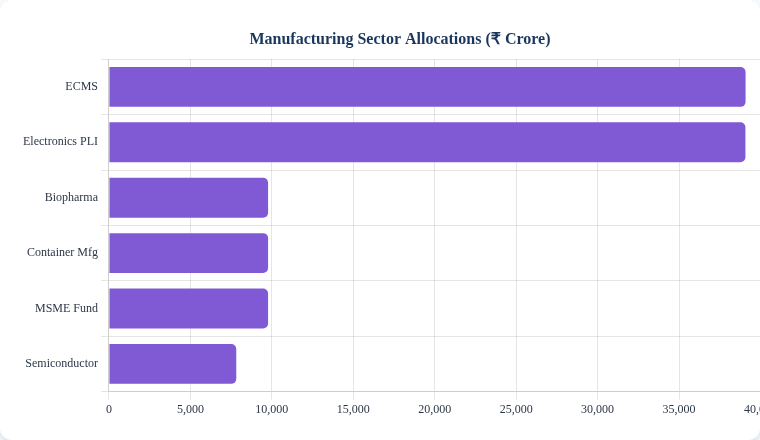
Key Manufacturing Allocations
| Initiative | Allocation | Objective |
|---|---|---|
| Electronics Components Manufacturing (ECMS) | ₹40,000 crore | Build component ecosystem |
| Electronics PLI Scheme | ₹40,000 crore | Production incentives |
| Biopharma SHAKTI | ₹10,000 crore (5 years) | Global biopharma hub |
| Container Manufacturing Scheme | ₹10,000 crore (5 years) | Maritime self-reliance |
| MSME Growth Fund | ₹10,000 crore | Equity support for MSMEs |
| Semiconductor Ecosystem | ₹8,000 crore | Compound semiconductors |
Critical Assessment
- Execution Gap: PLI schemes have disbursed only ₹23,946 crore against committed outlays of ₹1.97 lakh crore—a 12% utilization rate.
- Global Competition: US CHIPS Act allocated $52 billion, EU €43 billion. India's ~$4.5 billion is modest by comparison.
- Talent Shortage: India lacks specialized workforce for semiconductor manufacturing.
- Infrastructure: Semiconductor fabs require massive power and ultrapure water—gaps remain unaddressed.
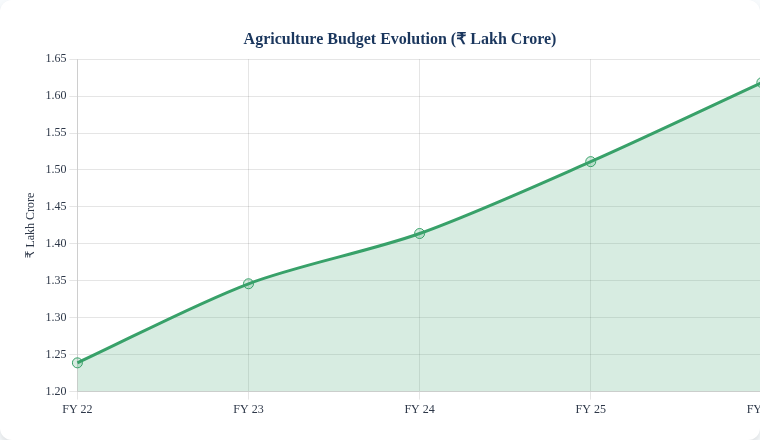
7. Agriculture & Farmers: Promises vs Reality
Agriculture employs 42% of India's workforce but contributes only 17% to GDP. Budget 2026-27 allocates ₹1,62,671 crore to agriculture and allied activities.
Key Agricultural Initiatives
- BHARAT VISTAAR: AI-based multilingual advisory platform for farmers
- Coconut Promotion Scheme: Targets 30 million beneficiaries
- Indian Cashew & Cocoa Programme: Premium global branding by 2030
- Fisheries Development: 500 reservoirs for integrated fisheries
- Animal Husbandry: 20,000+ veterinary professionals through new scheme
- SHE Marts: Self-Help Entrepreneur marts for women-led rural enterprises
What's Missing
- No increase in PM-KISAN payment (remains ₹6,000/year since 2019)
- No mention of MSP legal guarantee—a key farmer demand
- MGNREGS allocation stagnant despite rural distress
- No concrete steps on debt relief for farmers
8. Defence Budget: Post-Sindoor Security Calculus
In the backdrop of Operation Sindoor (2025) and continuing geopolitical tensions, the defence budget has received its most significant boost in years. Total allocation: ₹7,84,678 crore, marking a 15.2% increase.
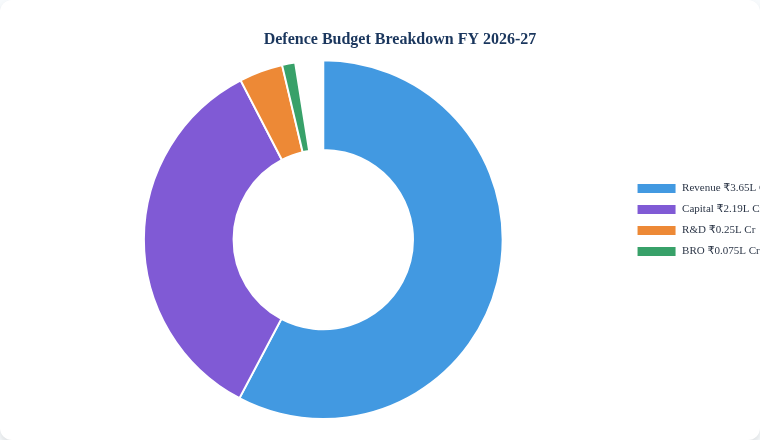
Defence Budget Components
| Component | Allocation (₹ Cr) | YoY Change |
|---|---|---|
| Revenue Expenditure (Salaries, Pensions) | 3,65,479 | +17.2% |
| Capital Outlay (Procurement) | 2,19,306 | +21.8% |
| Defence R&D | ~25,000 | +15% |
| Border Roads Organization | 7,500 | +12% |
Key Focus Areas
- Medium Role Fighter Aircraft (MRFA): Big-ticket acquisition priority
- Unmanned Aerial Systems (UAS): Counter-UAS capabilities expanded
- Indigenous Manufacturing: Positive indigenization list expanded
- Aerospace: Customs duty exemptions for aircraft parts and defence MRO
9. Who Wins, Who Loses: Segment-wise Impact
WINNERS
| Segment | Key Benefits | Rating |
|---|---|---|
| Infrastructure Companies | ₹12.2L cr capex, 7 high-speed rail corridors | ★★★★★ |
| Defence Contractors | 21.8% capital outlay increase, indigenization push | ★★★★★ |
| Semiconductor/Electronics | ISM 2.0, ₹40,000 cr ECMS, PLI expansion | ★★★★☆ |
| MSMEs (High-growth) | ₹10,000 cr Growth Fund, credit guarantee expansion | ★★★★☆ |
| Rural Women Entrepreneurs | SHE Marts, Lakhpati Didi expansion | ★★★☆☆ |
| Tourism Sector | 50 tourism sites development with states | ★★★☆☆ |
LOSERS
| Segment | Concerns | Rating |
|---|---|---|
| Salaried Middle Class | Zero tax relief, rising STT | ★☆☆☆☆ |
| F&O Traders | STT hike on derivatives | ★☆☆☆☆ |
| Small Farmers | No PM-KISAN increase, no MSP guarantee | ★★☆☆☆ |
| Healthcare Seekers | Health at 1.96% of budget | ★★☆☆☆ |
| Senior Citizens | No specific relief measures | ★★☆☆☆ |
| Students/Education | Education at 2.6%—below benchmarks | ★★☆☆☆ |
10. The Verdict: Expert Assessment
Overall Rating: 6.5/10 — A Workmanlike Budget, Not a Visionary One
What Works
- Fiscal Discipline: Maintaining the deficit glide path while increasing capex
- Infrastructure Focus: ₹12.2 lakh crore capex continues growth-oriented strategy
- Manufacturing Push: Doubling down on semiconductors is strategically sound
- Defence Modernization: Post-Sindoor security investments are necessary
- Debt Management: Shifting to debt-to-GDP targeting provides flexibility
What Doesn't Work
- Middle Class Neglect: For the second consecutive year, the salaried class gets nothing
- Social Sector Underinvestment: Health at 1.2% of GDP and education at 2.6% are inadequate
- Agricultural Stagnation: High-value crops don't address immediate farmer distress
- Execution Gaps: Announcement-to-implementation ratios remain poor
- Rising Borrowing: 47% jump in gross borrowing raises sustainability questions
The Bigger Picture
Budget 2026-27 is a budget of continuity over change. It continues the infrastructure-led growth model, maintains fiscal prudence, and doubles down on manufacturing—all sensible policies. However, it fails to address emerging challenges: a consumption slowdown driven by middle-class squeeze, persistent rural distress, and woefully inadequate public services.
"This budget prioritizes reform over rhetoric and action over ambivalence. But reform for whom? The corporate sector and infrastructure companies will cheer. The salaried employee opening their salary slip will find no reason to." — Economic Analyst
Final Word
If you're an infrastructure contractor, a defence manufacturer, or a semiconductor entrepreneur, this is your budget. If you're a middle-class taxpayer, a small farmer, or someone relying on public healthcare, you'll have to wait another year—or longer—for your turn.
This analysis is for informational purposes only. For personalized financial advice, consult a qualified professional. Data sourced from Union Budget documents, PIB, and official government publications.